The dice theme continues this week with a p5 program that lets you roll a variety of dice and observe the historical distribution of your rolls.

Play with it here (best done on a computer, not mobile).
Inspired by D&D and my general fascination with stats – this is designed as an interactive and informational tool to observe what distributions can be expected. Compare, for example…
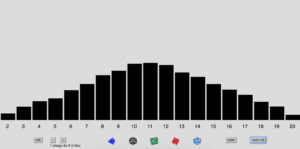
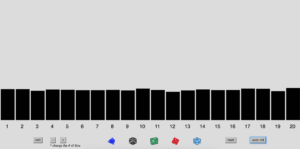
…the distribution of two 10-sided dice versus one 20-sided dice after 50 rolls:
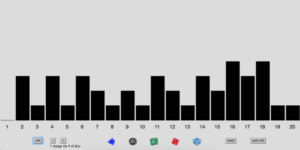

After a few seconds of the ‘auto-roll’ function (which you can toggle on/off) you can see the difference even more clearly:
This program was made possible through use of arrays and DOM elements. For this particular situation, I found the DOM elements to be a little clunky – perhaps because it is a function-oriented situation. Having to make a single button and corresponding function for each element that affected the distribution felt a little repetitive.
Perhaps making a class for the two types of elements would have reduced the repetition… but I still don’t see how I could cut down on the number of corresponding functions that would have to be made. Is it generally accepted that a quick function is worth the effort, even if it only does one little thing? Is it possible to use anonymous functions here?
If this is every returned to, you may find the following improvements:
-
- Status information including:
-
- A highlighting of the current die selection
- A better indication of the maximum value of each die (for those of us who don’t already know)
-
- A textual indication of how many dice are currently being rolled.
-
- The most recent outcome rolled
- The average value (and median, i guess ?) as well as standard deviation of the current roll set
-
- A less boring set of colors – possibly with ‘heat-mapped’ values, where more frequent (i.e. taller bars) are ‘hotter’ colors
- More elegant fonts, relative sizes and buttons
- A background that draws the associated distribution
- Status information including: